Capability Map for Natural Muon Imaging Applications: Integrating Depth, Precision, and Observation Time into a Single Chart
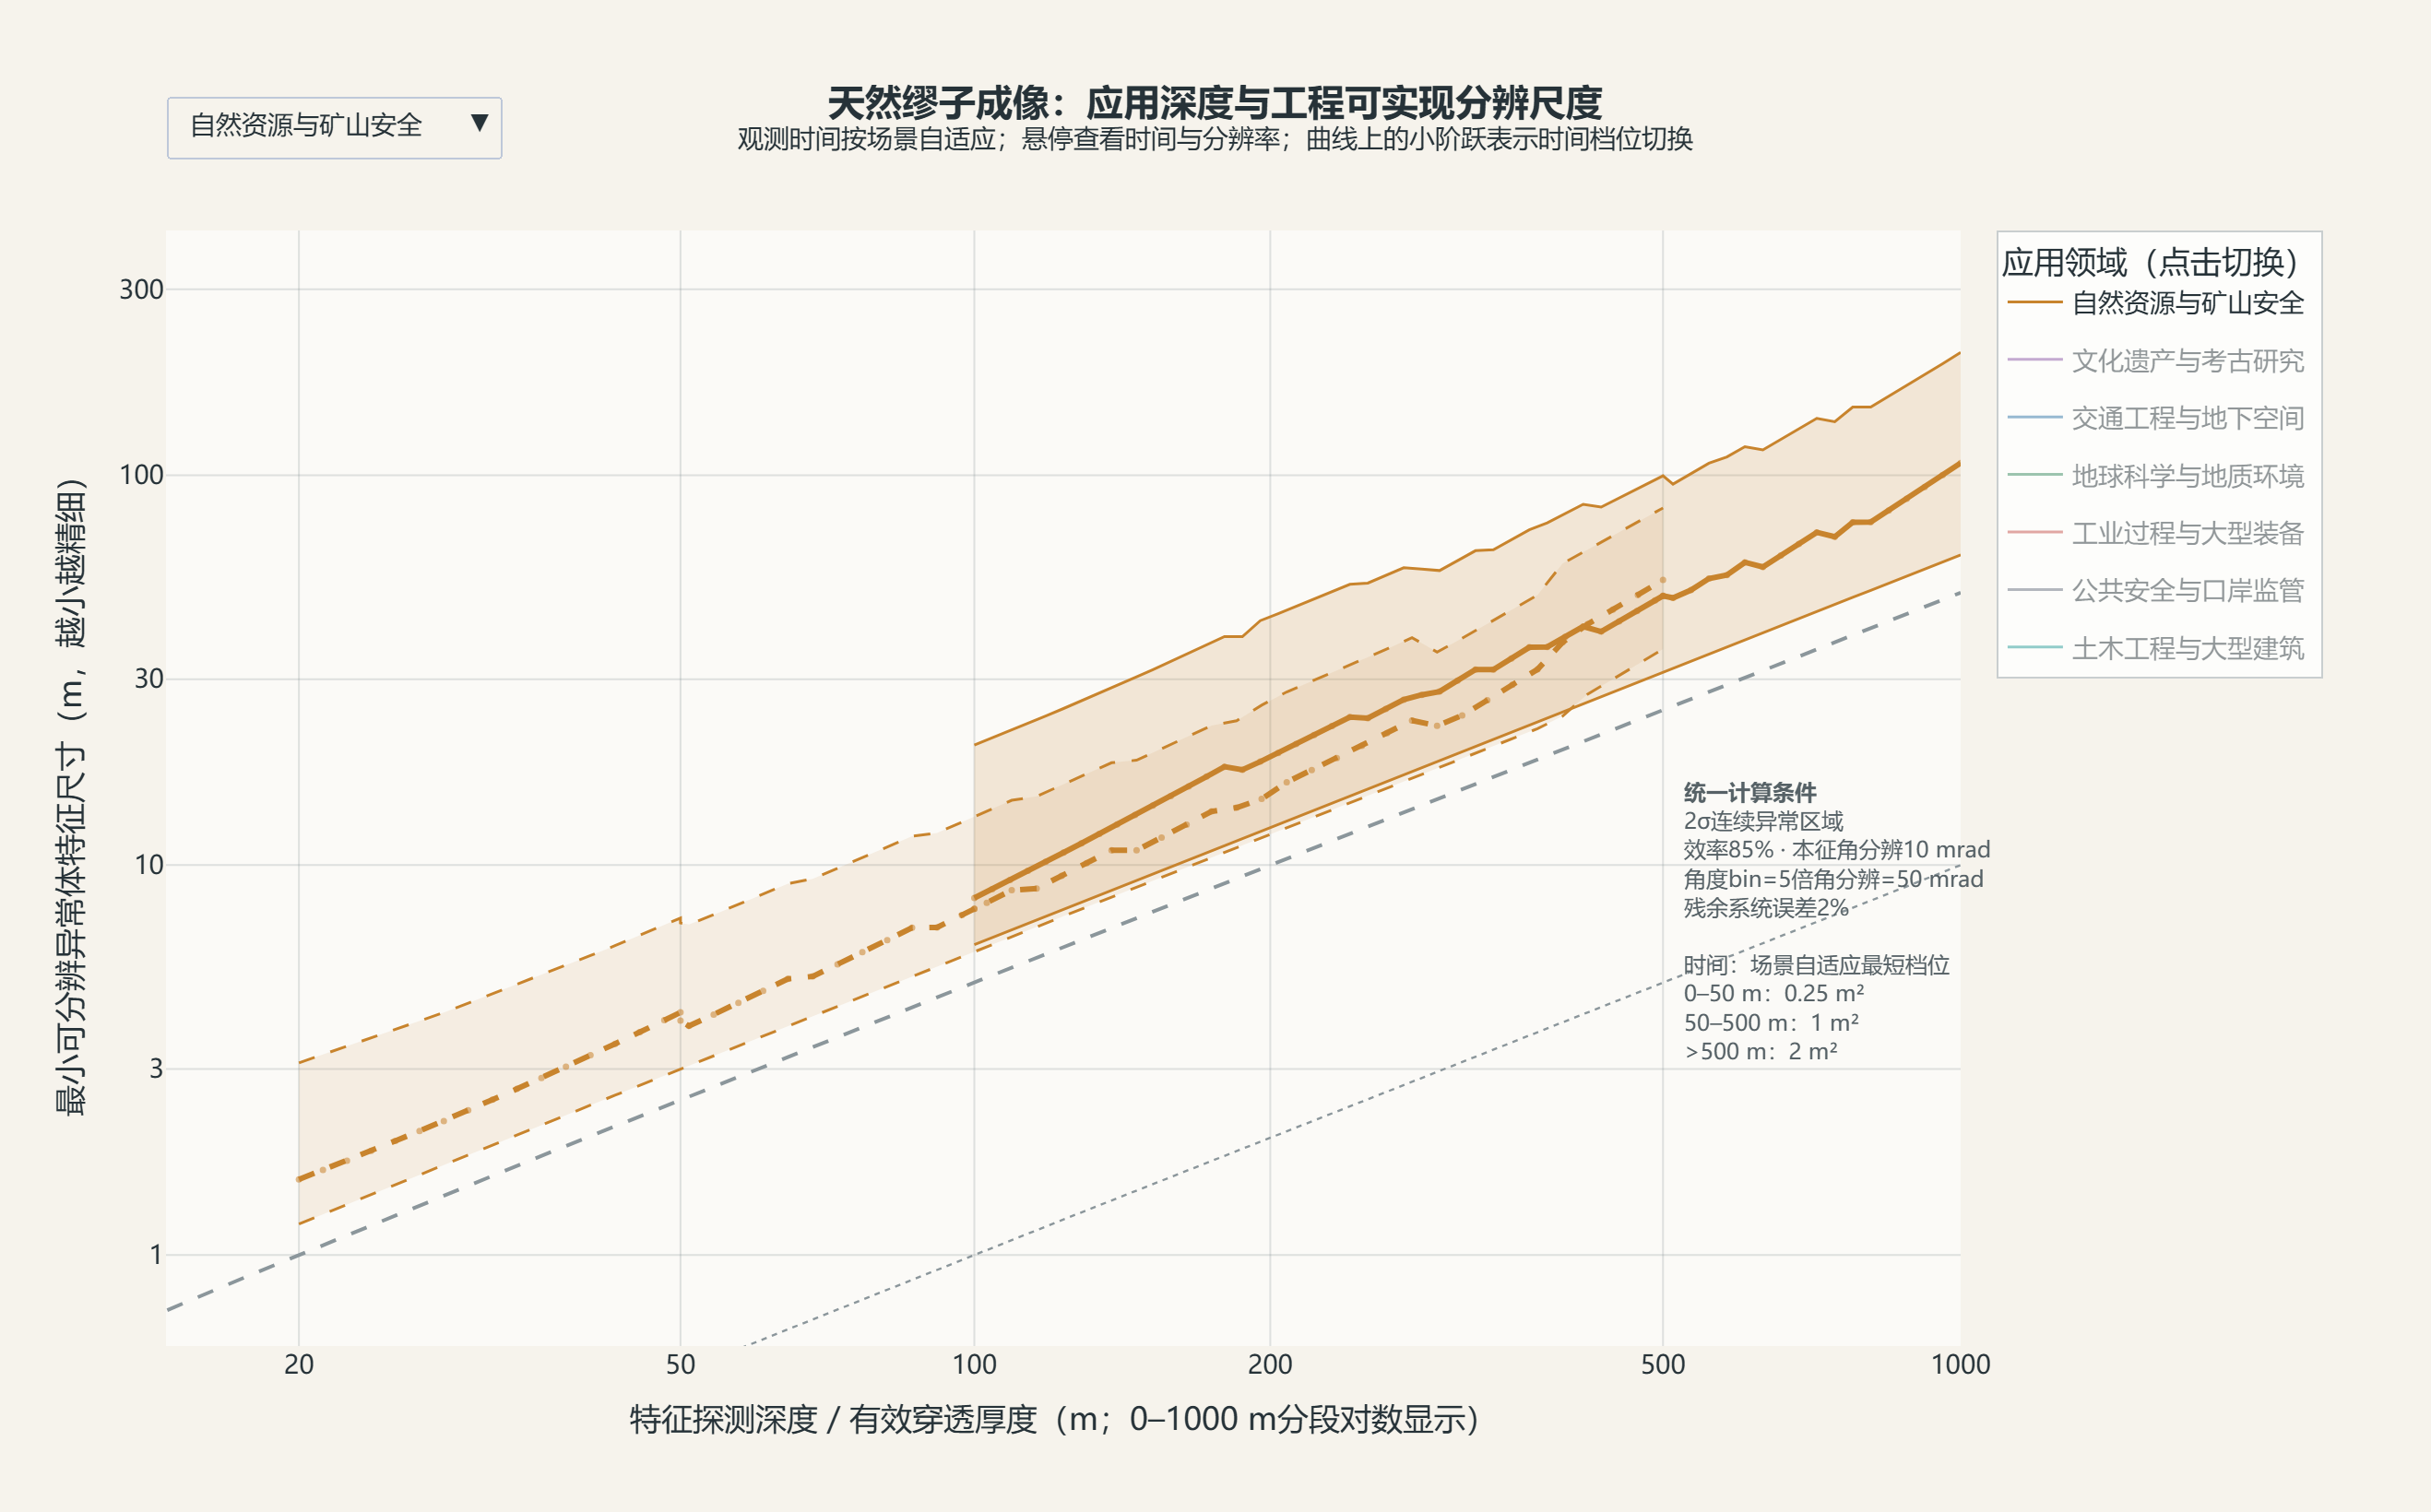
In discussions regarding natural muon imaging projects, we are frequently asked several questions that appear simple but actually require context-specific answers: How deep can it probe? What level of detail can it resolve? What size detector is required? How long must the observation last? To help professionals in fields such as mining, archaeology, transportation, geosciences, industry, public safety, and civil engineering intuitively grasp these issues, we have launched the "Natural Muon Imaging Application Capability Map" .This is not a chart that merely advertises "peak precision" in a vacuum; rather, it serves as a tool for scientific communication and preliminary project assessment, enabling users to compare target depth, density contrast, detector scale, observation duration, and achievable resolution within a unified framework.
[Open the capability map for natural muon imaging applications immediately.]
What is this tool?
The capability map for natural muon imaging applications is an interactive, semi-quantitative analysis tool. Plotting target depth (or effective penetration thickness) on the horizontal axis and the minimum resolvable characteristic size of anomalous bodies on the vertical axis, the map illustrates the approximate range of natural muon imaging capabilities as they vary with depth across different fields and scenarios.
Currently, the knowledge graph covers seven core domains:
Natural resources and mine safety;
Cultural heritage and archaeological research;
Transportation engineering and underground space;
Earth sciences and geological environments;
Industrial processes and large-scale equipment;
Public safety and port supervision;
Civil engineering and large-scale structures.
The tool integrates density contrast, detector area, angular binning, statistical significance, and industry-standard observation times into a unified model. Users can switch domains, view scenario envelopes, and—by hovering the cursor—read the resolution scale, detector area, and adaptive observation time at the current depth.
It should be noted that the vertical axis represents the minimum resolvable characteristic size of an anomalous body; it does not refer to the detector's positional resolution (which is on the order of millimeters) or the precision of structural displacement monitoring.
Why is this tool needed?
The "precision" of natural muon technology is not a figure that can be defined in isolation from specific conditions.
When the same detector system is applied to targets ranging from a 20-meter-thick archaeological site to a 100-meter-deep void or a 600-meter-deep ore body, factors such as muon flux, required observation time, density contrast, and achievable spatial resolution will vary significantly. Citing only a "maximum precision" figure can easily lead to several misconceptions:
Confusing the detector's positional resolution with the imaging resolution of the underground target;
Overlooking the drop in flux associated with greater depths;
Ignoring the impact of density contrast magnitude on anomaly prominence;
Assuming that all projects require the same observation time;
Using metrics intended for void detection to evaluate distinct tasks such as nuclear material detection, displacement monitoring, or the detection of millimeter-scale fractures.
Therefore, we aim to use an interactive chart to discuss "visibility, resolution, duration, and detector size" in conjunction, shifting technical dialogue from a single precision figure back to real-world industry challenges.
Where are the tool links?
Tool Access:
[Capability Map for Natural Muon Imaging Applications]
We recommend using a desktop browser for a more complete interactive experience; mobile viewing is also supported, allowing you to view the full charts in landscape mode.
How does it benefit industry stakeholders?
Natural Resources and Mine Safety
Enables comparison of target scales and burial depths—such as ore bodies, goafs, and water-bearing structures—to determine whether natural muon imaging is suitable for target delineation, 3D density constraints, or hazard screening, while helping to estimate detector scale and project timelines.
Cultural Heritage and Archaeology
Translates "non-destructive detection" requirements into actionable spatial scales and observation durations, helping to assess the suitability of muon technology for investigating underground spaces at large heritage sites, concealed water channels, or internal anomalies within medium-sized artifacts.
Transportation Engineering and Underground Space
Distinguishes between rapid quality control during tunnel construction and deep geological surveys of overburden, helping project teams determine if muon observations can fit within existing construction or operational schedules.
Earth Sciences and Geological Environments
Visually demonstrates the statistical trade-offs associated with increasing penetration thickness when imaging volcanoes, large rock masses, glaciers, karst features, and landslide bodies, providing a reference for observation station layout, long-term monitoring, and the design of spatiotemporal resolution.
Industrial Processes and Large-Scale Equipment
Integrates operational cycles—ranging from hours to days—into the model to determine whether scenarios such as blast furnaces, vessel material levels, or reactors allow for rapid status identification or require longer durations for detailed structural imaging.
Public Security and Border Control
Helps distinguish between transmission imaging and scattering/detection tasks, ensuring that spatial resolution metrics for underground voids are not conflated with parameters relevant to high-Z materials, such as detection probability, localization precision, or minimum detectable mass.
Civil Engineering and Large-Scale Structures
Translates structural defects in dams, levees, bridges, and urban lifelines into equivalent density anomalies, allowing for a preliminary assessment of whether targets—such as zones of deterioration, voids, or seepage channels—fall within the detectable range.
How do I use it?
a. Select the application domain. Use the domain menu at the top left of the interactive chart to access the zoomed-in view for the specific domain.
b. Determine the target depth. The horizontal axis represents the target depth—or the effective penetration thickness between the target and the detector—which does not necessarily equate to the depth of burial below the ground surface.
c. Examine the scenario envelope. The upper and lower boundaries of the shaded band correspond to the "fine" (high-resolution) and "conservative" limits under varying density contrasts, while the bold line represents the representative result.
d. Hover to view parameters. Move the cursor over the curve to display the current depth, resolution scales (at three levels), background density, detector area, and adaptive observation time.
e. Interpret results in the context of specific professional objectives. Assess whether the scales shown in the chart are sufficient for tasks such as exploration, risk screening, structural identification, or condition monitoring, rather than simply aiming for the lowest numerical values.
f. Recalculate before commencing the actual project. Conduct specialized simulations and validation using site-specific topography, actual path lengths, observation angles, background density, and detector acceptance characteristics.
The small steps appearing in the curves in the figure primarily result from switching the detector area or the observation time interval; they do not indicate a sudden change in the natural muon flux.
Research Use and Disclaimer
This tool—including its text, charts, parameter ranges, and calculation results—is intended solely for scientific exchange, public outreach, discussions on technical approaches, and preliminary project feasibility screening.
This tool does not constitute engineering design, site investigation findings, investment advice, a basis for construction, quality acceptance opinions, safety assessments, hazard warnings, regulatory conclusions, legal opinions, or any form of professional commitment. The results presented are based on standardized assumptions and semi-quantitative models; they do not necessarily reflect the performance a specific project would achieve under actual conditions regarding terrain, equipment, environment, and inversion parameters.
No entity or individual should make decisions concerning personal safety, engineering safety, production operations, cultural heritage management, resource reserves, investment, or regulatory enforcement based solely on this tool. Users should engage teams with appropriate professional expertise to make judgments by integrating site-specific data, specialized simulations, equipment calibration, independent technical reviews, and applicable standards.
The provider of this tool assumes no liability—to the extent permitted by applicable law—for any direct or indirect consequences arising from the citation, interpretation, use, or reliance upon the tool's content. Use of this tool signifies the user's understanding and acceptance of the aforementioned scientific purposes and limitations.
Natural muon imaging is an evolving field. We hope this tool serves as a "common language map" bridging professionals across various industries and muon technology teams, enabling more accurate problem formulation and a more honest understanding of the technology's capabilities and limitations.

 Gansu PSB Record No.62010202000830
Copyright ©2025 Muon Exploration Laboratory. All Rights Reserved.
